Research area category:

Network analysis
- Social network analysis algorithms
- Dynamic graph visualization techniques
- Gene regulatory networks
- Metadata mapping and pattern discovery
- Bibliomatric analysis, scientometrics graphs
- Complex networks in other applications
Science mapping from a bibliometric perspective
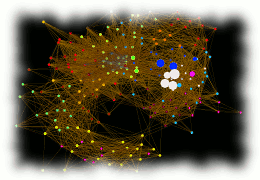
Network visualization helps uncover interesting and evolving relationships between various areas of scholarly activity. Here we use a sigma.js javascript framework to render an interactive map of science that is based on journal subject categories and aggregated citation data.