Transcending
Traditional disciplinary boundaries
Integrating computational sciences with machine learning
We bring innovation across the boundaries of traditionally-defined disciplines, and combine theoretical models with data-driven machine learning approaches. Specific applications range from biomarker discovery to novel materials and financial forecasting.
Explore research areas »Our recent developments
Biomarker discovery from high-throughput data: Variable selection methodology inspired by computational physics techniques (see toolbox overview).
Recent insights by tag (scroll to zoom)
Research highlights
- Proteomic biomarkers of breast cancer prognosis: Emphasis on accurately identifying high metastatic risk patients
- Biocompatibility: Predicting protein resistance properties of molecular monolayers
- Drug discovery: Accounting water effects when computing small molecule drug-target interactions
- Water in protein and membrane pores: A coarse-grained molecular theory approach
- Nanoscale forces: Computing nanoparticle interactions
Physics-inspired biomarker discovery toolbox
Multi-disciplinary Insights has developed biomarker discovery tools that identify the smallest number of key variables most essential for a given biological context from high-throughput datasets. The algorithm is inspired by statistical physics of strongly interacting systems, and uncovers most sensitive predictor combinations for medical diagnosis and prognosis applications.
Science mapping from a bibliometric perspective
Network visualization helps uncover interesting and evolving relationships between various areas of scholarly activity. Here we use a sigma.js javascript framework to render an interactive map of science that is based on journal subject categories and aggregated citation data.
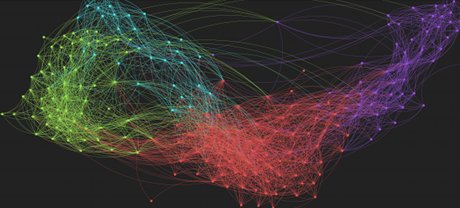
About the map of science dynamic banner
The top banner on this page presents part of the map of science visualization (move the mouse to thetop of the page to explore). This particular network of scientific fields is constructed based on a bibliographic analysis of journal citations:
- Network nodes correspond to scholarly journal subject categories by Thomson Reuters;
- Edges are based on aggregated journal-journal citations.
This graph is a good illustration for the interconnectedness of various disciplines and their relationship to each other.
More details can be found on our structure of science page.